Shop By Categories
- Arts Design
- Engineering and Technology
- Agriculture and Natural Resources
- Arts and Humanities
- Biological Sciences
- Business, Management, and Economics
- Civil Engineering
- Earth Sciences
- Health Sciences
- Humanities and Social Sciences
- Management Sciences
- Environmental Sciences and Natural Resources
-
Medicine
- Anesthesia
- Internal Medicine
- Plastic Surgery and Otorhinolaryngology (ENT)
- Public Health
- Sports Medicine and Rehabilitation
- Basic Medical Sciences
- Behavioral Sciences and Psychology
- Blood and Cancer
- Cardiology and Cardiac Surgery
- Dentistry
- Dermatology
- Emergency
- Gynecology and Obstetrics
- Neurology
- Nursing
- Nutrition
- Ophthalmology
- Orthopedic
- Pathology and Laboratory Sciences
- Pediatrics
- Pharmacy
- Radiology
- Surgery
- Urology
- Veterinary Medicine
- Natural Sciences
- Smart Technologies
- Social Sciences
Computer Engineering
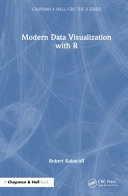
Modern Data Visualization with R
PDF Version(0 reviews)
$5
1 people are viewing this right now
Useable discount codes:
25% Off
APPLY
-
ISBN:
9781032289496
-
Author/Authors:
-
Publisher:
CRC Press
-
Categories:










0 Comments